Josué Molina
Data Analyst | Musician
Email me
View My LinkedIn Profile
Debt and Development in the Levant: Jordan and the World Bank
![]()
Many countries have a rich history going back a millennium and a half. Some countries have histories going back multiple millennia. One of those countries is Jordan, a fascinating country that we know a lot about starting in ancient history. Naturally, when I started the first SQL project in Avery Smith’s Data Career Jumpstart, I knew that I would focus on Jordanian data. Among Middle Eastern nations, Jordan is quite stable. Historically, they have also had much support and influence from the West. All this considered, I knew it would be interesting to see how Jordan matched up relative to other countries in the region (and across the world). Have they borrowed more or less than others? What kinds of projects have they directed those loans to?
I discovered that:
- Among Middle Eastern and North African countries, Jordan ranks 5th out of 10 in number of loans.
- Globally, Jordan ranks 80th out of 130 in amount owed to the IDA.
- Education and highways are among the top 10 project types pursued in Jordan.
Keep reading to see how I found out!
The Dataset
This dataset is a .csv file containing historical data from the IDA Statement Of Credits, Grants and Guarantees, which is available on the World Bank Group website. The data used for this project was updated on June 30, 2025. There are 1.4 million rows, making SQL a much better choice for analysis than Excel. I used CSVFiddle to write queries. I enjoyed how simple and straightforward the environment is - it’s perfect for learning SQL, while hosts like BigQuery can be more confusing for beginners.
It is worth noting that, as a historical database, the sums used in this project are “cumulative” sums, not regular sums. That is, when the amount owed is listed, it does not represent the amount owed in that instance. The choice to use cumulative sums versus regular sums was for simplicity’s sake.
Analysis
Overview
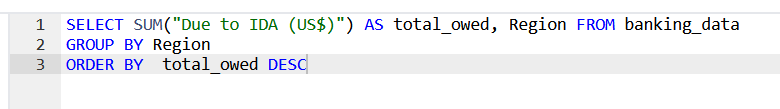
I decided to begin by seeing how the Middle East and North Africa (MENA) region compared to the other regions. I summed the amount owed to the IDA, grouped by region, and then placed the rows in descending order:
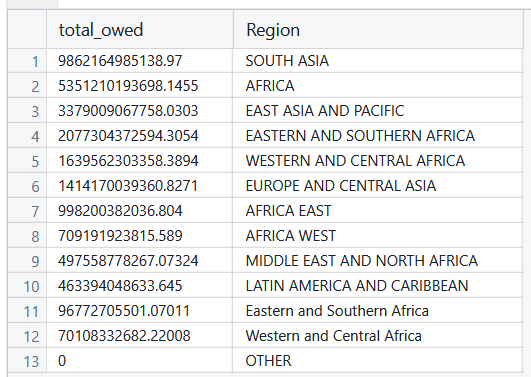
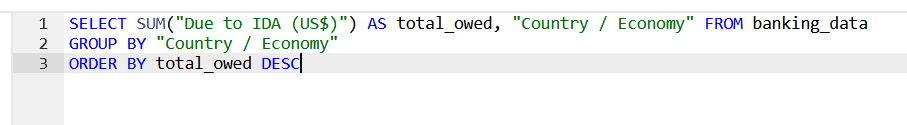
So, MENA ranks 9th out of 12. I then turned my attention to Jordan’s ranking global ranking in amount owed:
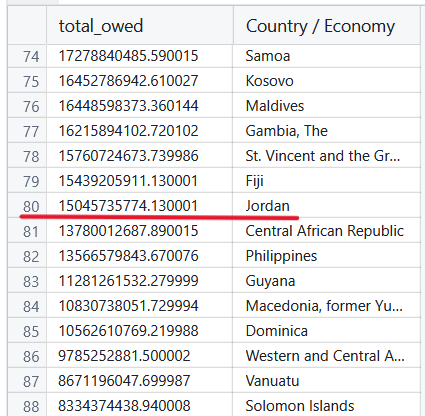
This shows a ranking of 80th out of 130. So, in terms of amount owed, Jordan is in the 40th percentile in amount owed to the IDA. It’s safe to say that Jordan is roughly middle-of-the-road.
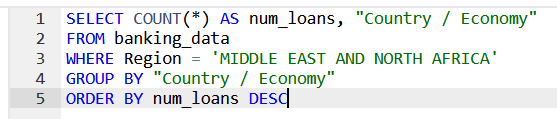
I was mainly curious about how Jordan compared to other MENA countries, so I dove deeper into trends within the region. I looked at the number of loans taken out and placed the countries in order:
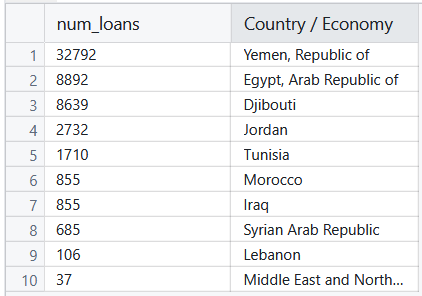
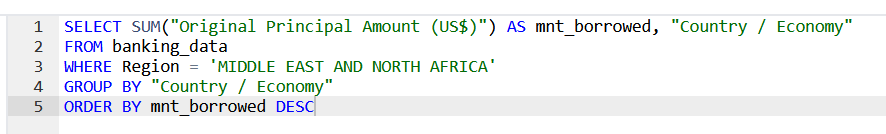
Being 4th in the number loans (2,732), it was natural to check the dollar amount of those loans to see if this changed anything. I decided to check by summing the principal amount of the loans by country:
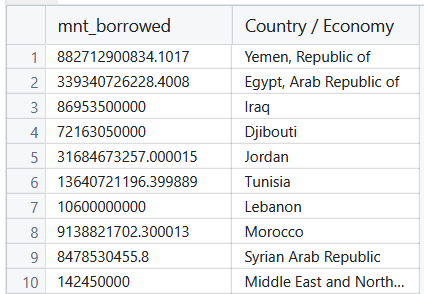
Finally, I made a comparison of service charge rate among MENA countries. In my initial query, I noticed that MENA showed up as a country name. Since this likely applied to an aggregate of the countries not represented individually in the dataset (perhaps because they have limited interaction with the IDA), I omitted them from the list with an AND clause. In this ranking, Jordan turned out with the second place spot:
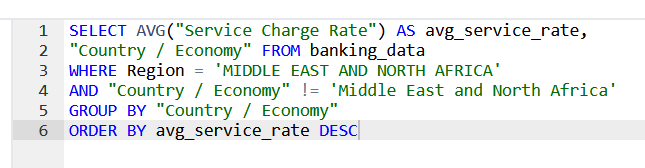
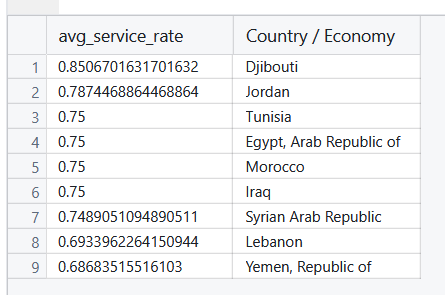
I think this makes sense. Since Jordan is better off than several of the countries in the region, they can afford to pay higher service charge rates.
After comparing Jordan with other countries, it was time to do a deeper dive into Jordan.
Jordan
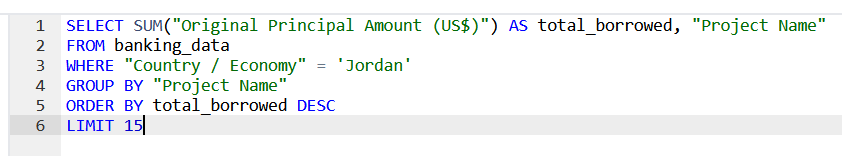
One of my initial goals was to find out what projects the loans go to. First, I found out which projects were the most common, and limited the selection to the top 15:
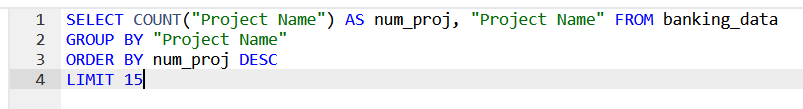
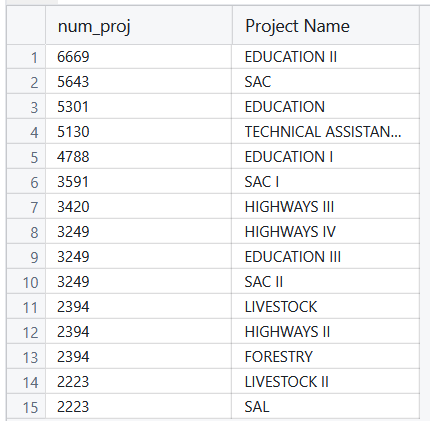
Education and highway projects populate the top 15 multiple times. I then found out which projects cost the most, or at least, which ones Jordan borrowed the most amount of money for:
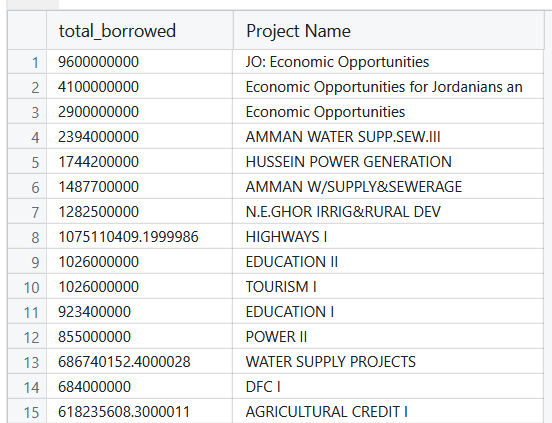
Unfortunately, the top 3 projects were labeled a very ambiguous “Economic Opportunities”, which does not tell us very much. However, my personal experience in Jordan could make sense of places 4, 6, and 7. I learned that Jordan is a very water scarce nation - it was necessary to constantly beware of water spent showering, cooking, and cleaning, lest you run out of water in your apartment for the rest of the week! Naturally, Jordan would want to invest projects concerning water supply and irrigation.
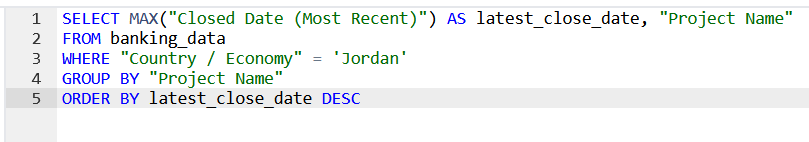
In order to practice using the MAX function in SQL, I used it to find out the latest date that Jordan closed on a loan. This date turned out to be slightly earlier than expected:
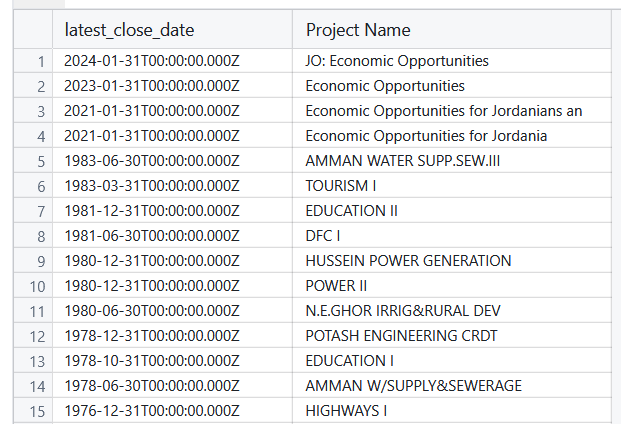
In 2021, two loans were closed. One loan was closed in each of 2023 and 2024. This makes for an average of one loan closed per year since 2021. These were all closed on 31 January. However, no loan was closed on 31 January of 2025. This could be a point of further research - perhaps, if there is a yearly schedule, Jordan will pay 2 next year to keep on track.
Review
During this project, I was once again impressed by the efficiency and utility of SQL. This analysis would have been too much for Microsoft Excel, but it was very manageable with SQL.
In this project, we learned that while Jordan is dependent on loans from the IDA, they are only moderately dependent compared to other nations. Their rankins in several categories put them at the halfway point (or lower half) for amount borrowed and other metrics. NGOs concerned with assisting developing countries may use this data to help them distribute resources across the region. For similar reasons, the IDA can also benefit from this information. Furthermore, This data can influence public perceptions of the economic state of the region - in terms of amount owed (being 9th out of 12), MENA is performing better than most regions.
Connect with me!
Thank you for looking at my SQL project! Feel free to connect on LinkedIn and share any feedback!