Josué Molina
Data Analyst | Musician
Email me
View My LinkedIn Profile
Welcome to My Portfolio!
Learn About My Projects
Data Analytics
A Dive Into FBI Crime Data (Excel, SQL, Tableau)
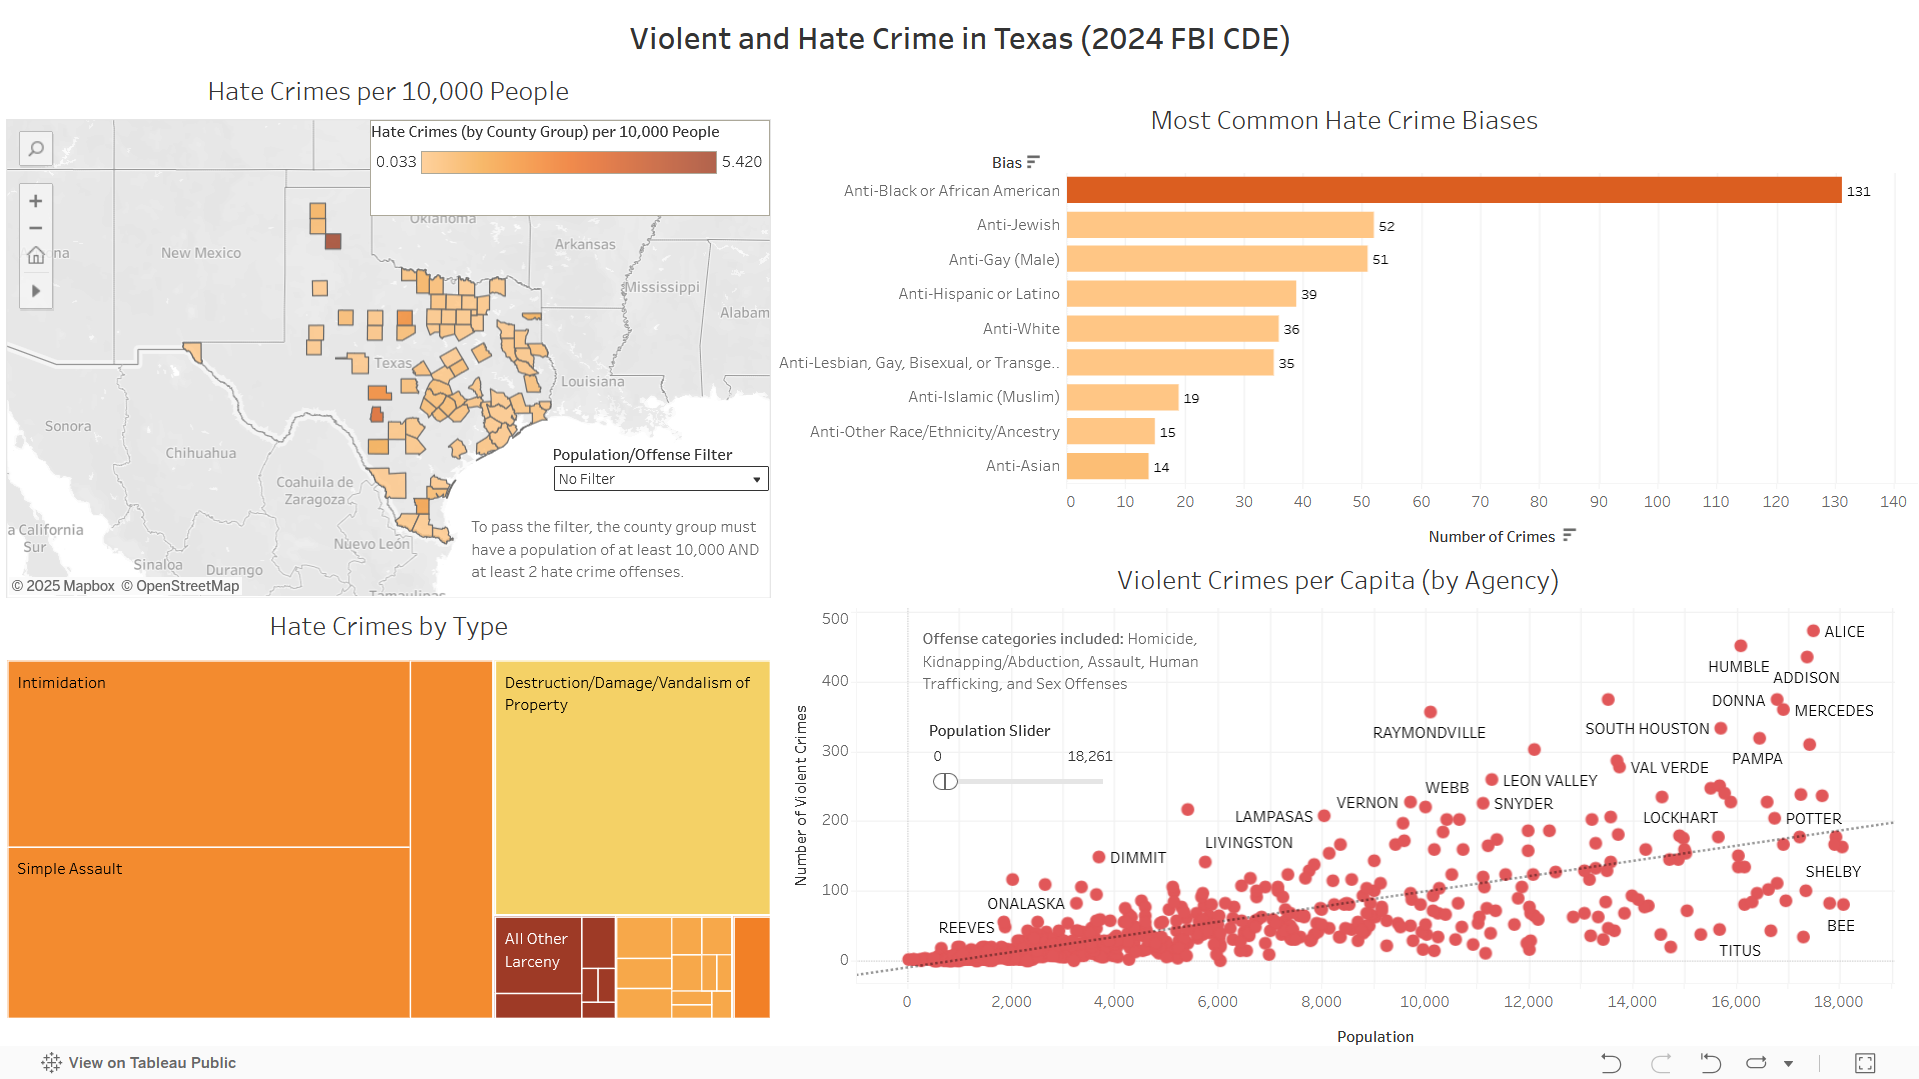 I got to practice Excel, SQL, and Tableau (and make a cool dashboard) in this fascinating crime data analytics project!
Supply Chain Analytics with Power BI
I helped a Supply Chain company solve business problems by making an interactive dashboard in Power BI!
Analytics of Human Beings: Employee Statistics with R
The statistical power of R is on full display in this People Analytics project.
Modern Mining Processes: Examining Iron Refinement with Python
Check out my foray into the data analytics side of Python using real-life iron refinement plant data.
Sports Analytics: A Glance at the 2024-2025 NBA Season using Tableau
My love for sports and Tableau come together in this basketball analytics project, give it a look!
Hospital Optimization Using SQL
 Read this project to find out about my deep dive into hospital data using more of SQL’s functions and capabilities.
Debt and Development in the Levant: Jordan and the World Bank (SQL)
 In this project, I utilized SQL to uncover aggregations from almost 1.5 million rows as I evaluated Jordan’s standing with the World Bank.
Food Delivery Analysis Projecct (Excel)
 I analyzed over 2000 rows of food delivery data using Microsoft Excel. I practiced Pivot tables, pivot charts, aggregation functions, and cleaning techniques among other things. I made the write-up in a LinkedIn article.
Education Project (Tableau)
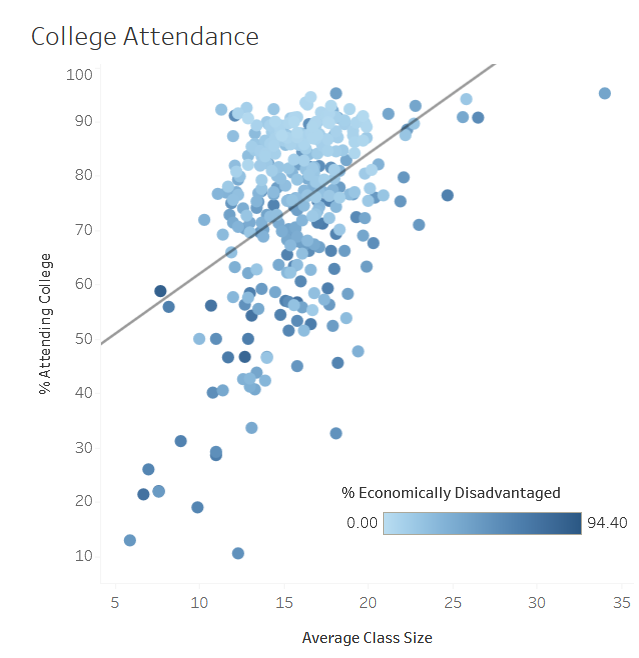 In this case study from Data Analytics Accelerator, I was prompted to analyze the State of Massachusetts education data. The main focuses were: What schools are struggling the most? How does class size affect college admission? What are the top math schools in the state? The link to the dashboard itself can be found here.
Mathematics Research/Projects
What are Your Chances of Winning Highlow?
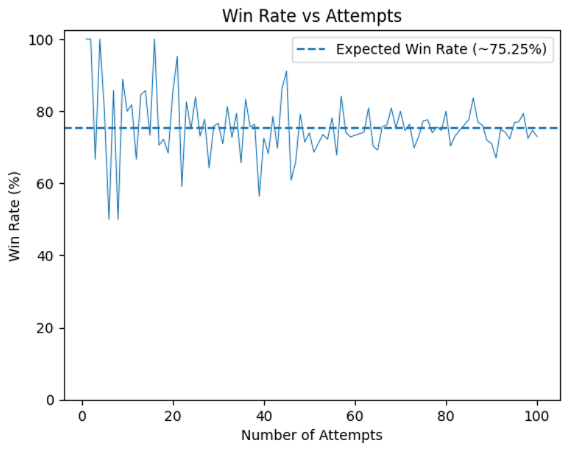 Winning a game is better than losing, and sometimes we can use math to help us find out how much we can expect to win. Read this project to see the power of mathematics to help us make predictions and find patterns in the world around us, including games.
Indiana University REU Project: Cubulated Holonomy
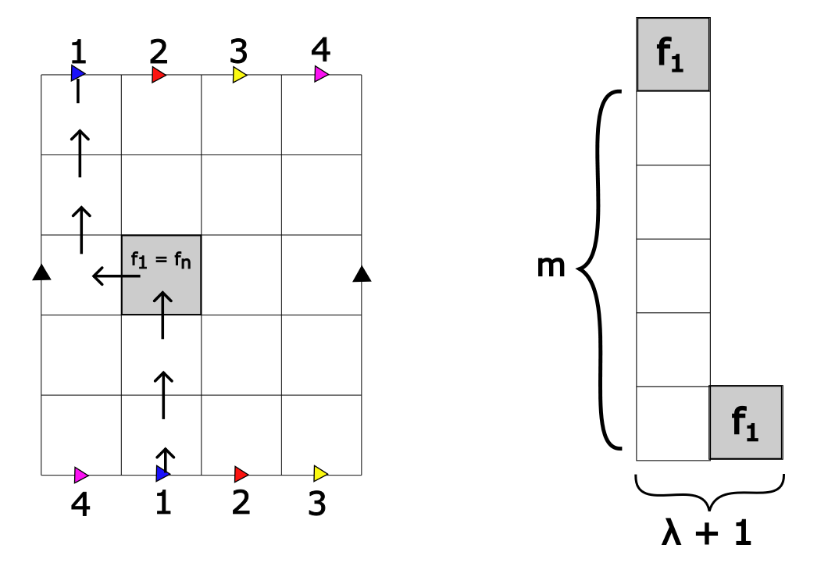 Stephanie Atherton and I collaborated on this NSF-funded research project in summer 2024! We focused on the following research question: given the holonomy group of the cube on a surface made of squares, what subgroups can we obtain by varying the surface? We used abstract algebra and algebraic topology to find out.
Using Data to Model Feral Cat Populations
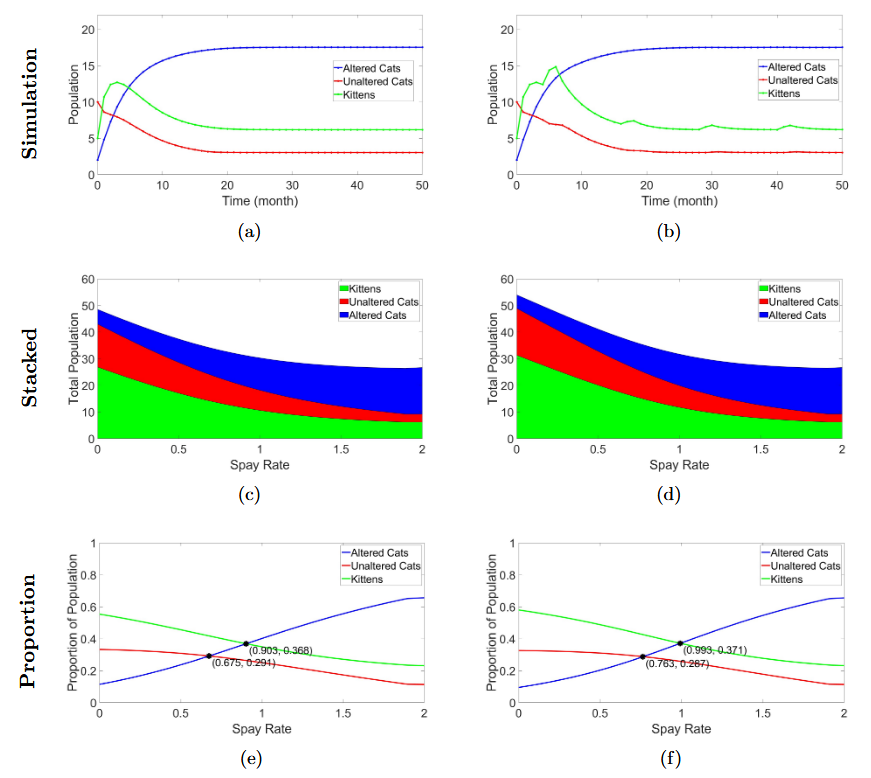 My senior year at Texas Tech, I took a mathematical modeling class in which each group used real-world, local data to create feral cat population models. In this project, I worked with Oladepo Gbemisola and Ryan Covington to produce equations and predictions based on the Trap, Neuter, and Return rates adopted by local shelters. My focus was on researching reasonable equation parameters and cleaning/visualizing over 8000 rows of local feral cat data in Microsoft Excel. The dataset can be found here. The final Google Slides presentation can be found here.