Josué Molina
Data Analyst | Musician
Email me
View My LinkedIn Profile
Optimizing Hospitals with SQL

Have you ever stayed at a hospital? Maybe you have been a patient; maybe you knew someone who was a patient and were keeping them company. There is a wide range of reasons that someone may be admitted to a hospital - some are more serious than others. Either way, a decent experience at the hospital is important (given the tough situations of the people staying there), and unfortunately those can be hard to come by at hospitals.
To the end of improving hospital experiences and overall efficiency, data analysis is an incredible tool. Specifically, for hospitals with large amounts of data, specific tools like SQL work great. In this project, I dove deep into hospital data using SQL to help answer potential helathcare provider questions, including:
- What is the distribution of time spent in the hospital?
- Are different races being treated with different standards of care?
- What are some of the top medications by age group?
Keep reading to see the answers and how I got them!
The Dataset
The dataset comes from a research article concerning hospital readmission. The link can be found here, and further information about the dataset can be found here.
Cleaning
I performed some brief data cleaning for some of the columns - some of the data types for numbers ended up as varchars instead of integers, so I wrote some queries using ALTER and MODIFY. I then wrote a query to return the data types of the columns to confirm the data types:
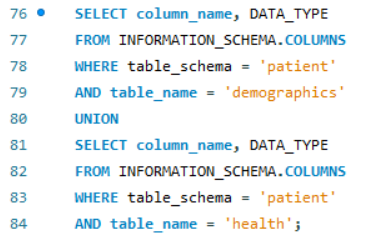
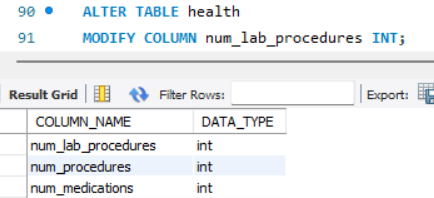
Now when I perform aggregations and order them later, it will do it numerically instead of alphabetically.
Analysis
To answer the question about time spent distribution, I created a histogram organized by time spent at hospital in days. I did not notice any decimal places in the “time spent” column, but just in case, I added a ROUND function to ensure that only integers were used in the calculations. I assigned an asterisk to every 100 patients, and this is what I got:
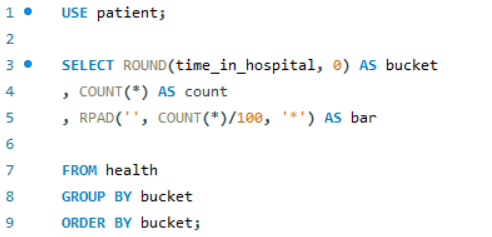
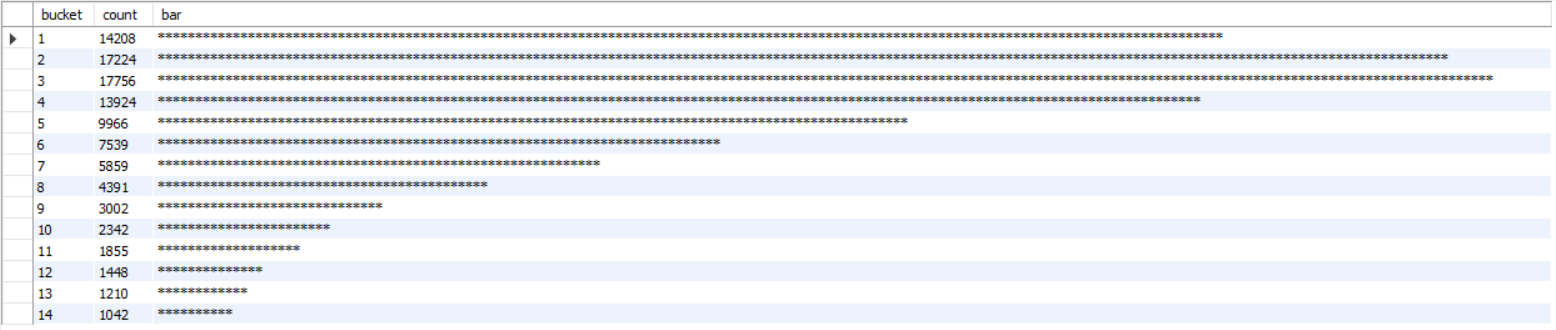
We can see that the most common length of stay is 3 days. We can also see that most stays are within one week, which is not too bad. While data visualization tools like Tableau and Power BI have SQL beat, it’s useful to know that I can pull a quick visualization with a short query.
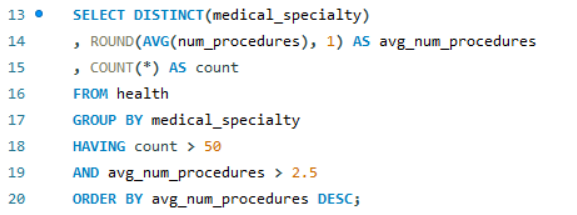
The next question I answered was: What are the top procedures administered? I organized the procedures by medical specialty, which I had to narrow with the DISTINCT function (since it was showing each instance of the medical specialty in the column). In order to highlight only the top procedures, I used the HAVING function to list only procedures with an average number higher than 2.5 and with at least 50 instances (so as to have a large enough sample size). I got the following result:
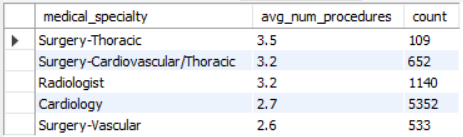
Thoracic surgery, including of the cardiovascular variety, and radiologist procedures top out the list. Further, procedures by the cardiologists had the largest sample size, at over 5000.
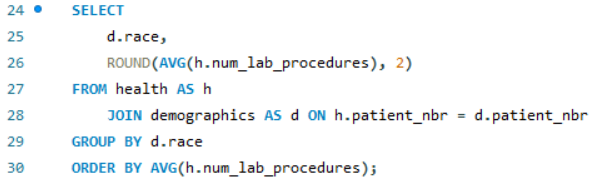
The next inquiry by the hospital staff is whether patients of different races are being treated differently in terms of number of procedures done. In order to provide insight for this question, I had to do a JOIN on the health and demographic tables in the dataset. Since I only cared about patients who actually had data on the number of procedures done AND their race, I used an INNER JOIN (implied with the use of JOIN alone) with the patient number key. I also decided to round the average number of procedures to make it cleaner. Here is the result:
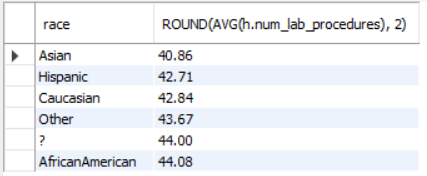
Thankfully, there is not a significant variance in the average number of procedures administered, signalling that there is likely equal treatment being practiced.
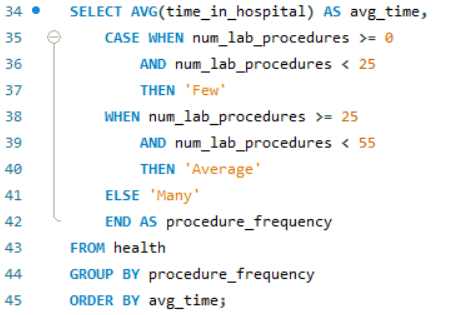
Next, I answered the following question: Is there a correlation between the length of stay and the number of lab procedures undergone by a patient? My hypothesis was that the answer is yes - more procedures means more time is needed to complete them. To see if this was right, I created groups based on the number of lab procedures using the CASE WHEN function. The “Few” lab procedures group had less than 25, the “Average” had less than 50, and the “Many” had at least 50. I then calculated the average length of stay. Here is the result:
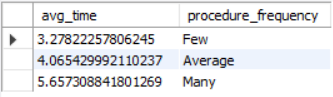
Based on this grouping, we do see that the average length of stay increases according to the number of lab procedures done, which reflects my hypothesis.
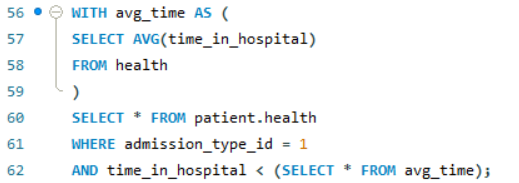
Next, I imagined the hospital manager wanted to know about some success stories - which emergency cases were resolved soon enough for the patient to have a below-average stay duration at the hospital? I took advantaged of CTEs and temporary tables for this question. I created an average time (avg_time) table, allowing me to select patients who had an emergency admission type and length of stay under this average time (using a subquery):
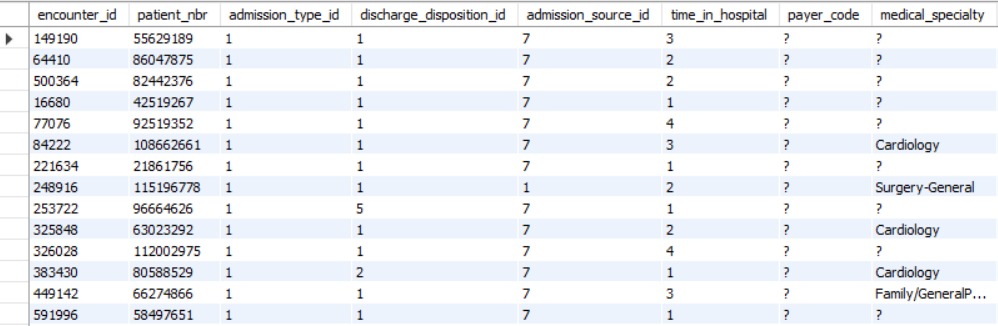
These rows can be further filtered and sorted to find any specific information. I made a separate query which returned the number of these rows, which was 33,684. That’s a lot of quick emergency visits!
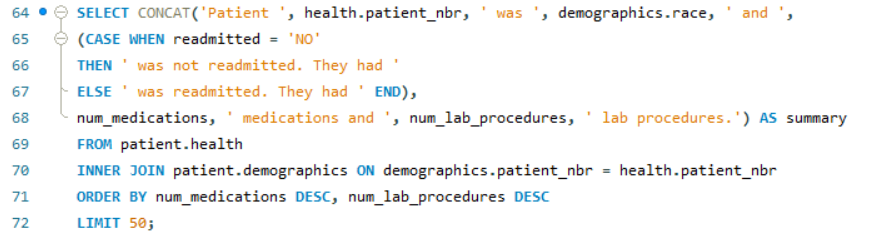
I thought it would be a good idea to produce a list summarizing each patient’s readmission, race, medication, and lab procedure status. In order to do this, I wrote a query using the CONCAT function. This produced a column with a text string containing placeholders for patient number, race, number of medications, and number of lab procedures. This required me to utilize the INNER JOIN again:
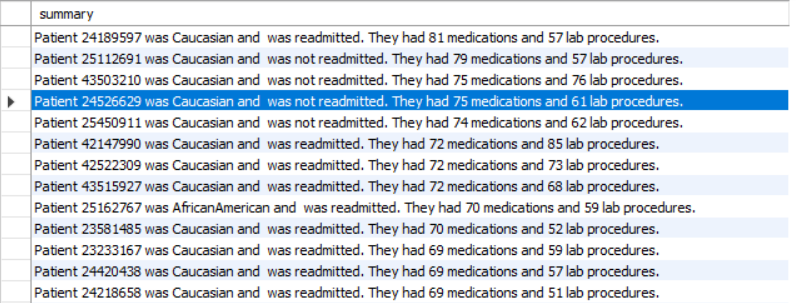
Since I altered the number of medications column to the integer data type, the ordering of the summaries is correct (descending, by number of medications). The cleaning work from earlier paid off!
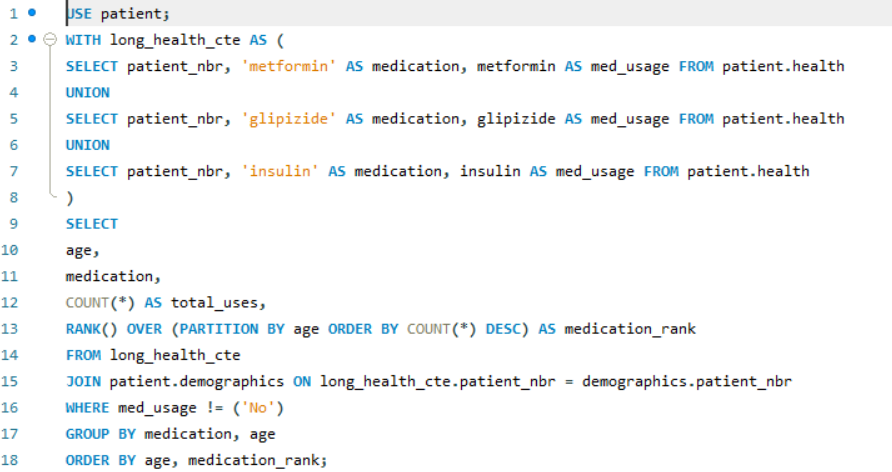
The final question I answered was: How are the top 3 medications ranked by age group? In order to find out, I first created a “long” table with the patient number and medication usage status for each of the top 3 medications (insulin, metformin, and glipizide). This was done with the help of the handy UNION function. This table made it easier to create the ranking; I could select the age, medication, and number of uses. Then, I could use a RANK over the age group to create a column denoting the rank of that medication for that age group. I had to use an INNER JOIN to combine the demographic and health tables, and I didn’t want to count non-usage of medication (‘No’ in the med_usage column). The result was a convenient table which could be further manipulated and sorted by rank:
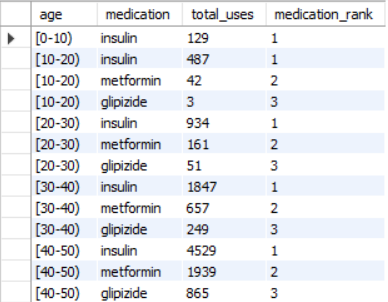
A simple question from the healthcare provider, but a pretty sophisticated query!
Takeaways
Using these aggregations and summaries, the hospital is able to make informed decisions to improve patient care. For example, the histogram showing duration of stay distribution can give the staff a better idea of where they stand compared to other hospitals. Maybe increasing the number of beds (or expediting hospital stays in general) will be a higher priority if there are too many stays over the industry standard. When it comes to race data, the hospital can ask further questions about why there are differences in procedures administered (even though we saw that they aren’t huge differences). Maybe the rates are disproportionate, even after considering certain conditions that are more prevalent in some races than others.
Thanks for Reading!
Once again, I have seen how powerful a tool SQL can be. I was glad to get some more experience with it, especially using more advanced functions. I can’t wait to keep using these for other projects! Connect with me on LinkedIn and share any feedback or comments you may have. Thanks for reading!